
User's Manual


11 Spectrum 18
7signal Ltd, Panuntie 6, FI-00620 HELSINKI, FINLAND, +358 40 777 7611, info@7signal.com, www.7signal.com
7signal Sapphire Loupe User Guide Release 3.1
11 SPECTRUM
Loupe displays the spectrum analysis results from the chosen time span.
In all of the spectrum charts, the swept frequency band lays on the x-axis. The band
constitutes of the 256 WLAN subcarrier channels that are mapped to frequencies and WLAN
channels, as described in below table:
Subcarrier
36
51
66
81
96
111
126
141
156
171
186
201
216
Frequency
2.412
2.417
2.422
2.427
2.432
2.437
2.442
2.447
2.452
2.457
2.462
2.467
2.472
Channel
1
2
3
4
5
6
7
8
9
10
11
12
13
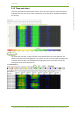
11.1 Over period chart
Loupe displays the spectrum analysis results from the chosen time span to assist you in
continuous monitoring. In the “over period chart”, the signal level is plotted on the y- axis, and
each antenna is represented by an individual chart. The swept frequency band is on the x axis.
If you select several Eyes, the results will be displayed individually for each Eye. To help to plot
signal levels to the actual WLAN channels (1-13), you can activate the “Add arcs for channels”-
checkbox. This selection adds parabolic lines to the chart to show the location of the selected
channel numbers.