
Application Guide


2 Using Loupe 3
7signal Ltd, Panuntie 6, FI-00620 HELSINKI, FINLAND, +358 40 777 7611, info@7signal.com, www.7signal.com
7signal Sapphire Loupe User Guide Release 3.0
2 USING LOUPE
Sapphire Carat gathers and aggregates into a database the results obtained from running the
chosen test profiles. Loupe enables you to view the results and make comparisons between
different devices, tests, and time spans.
The charts displayed on startup give a simplified view to the status of the networks. Loupe
offers many features for getting more detailed views.
Building a Result View:
1. Decide which group of indicators you want to view, for example Network
2. From the list, select the indicators from which you want to generate charts
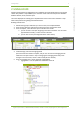
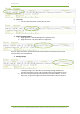
3. From the top bar, select the time span to include in the results
a. you can choose a time span by typing in the times and dates. You can either
type the date manually, or select it from a calendar.
b. you can also use the preconfigured values under History.
4. Under Average, select the averaging period
(The test results are based on samples, and you can use various averaging periods
within the time span chosen in step 3. Changing the averaging period may cause
changes in the test results, which is often exactly what is desired.)
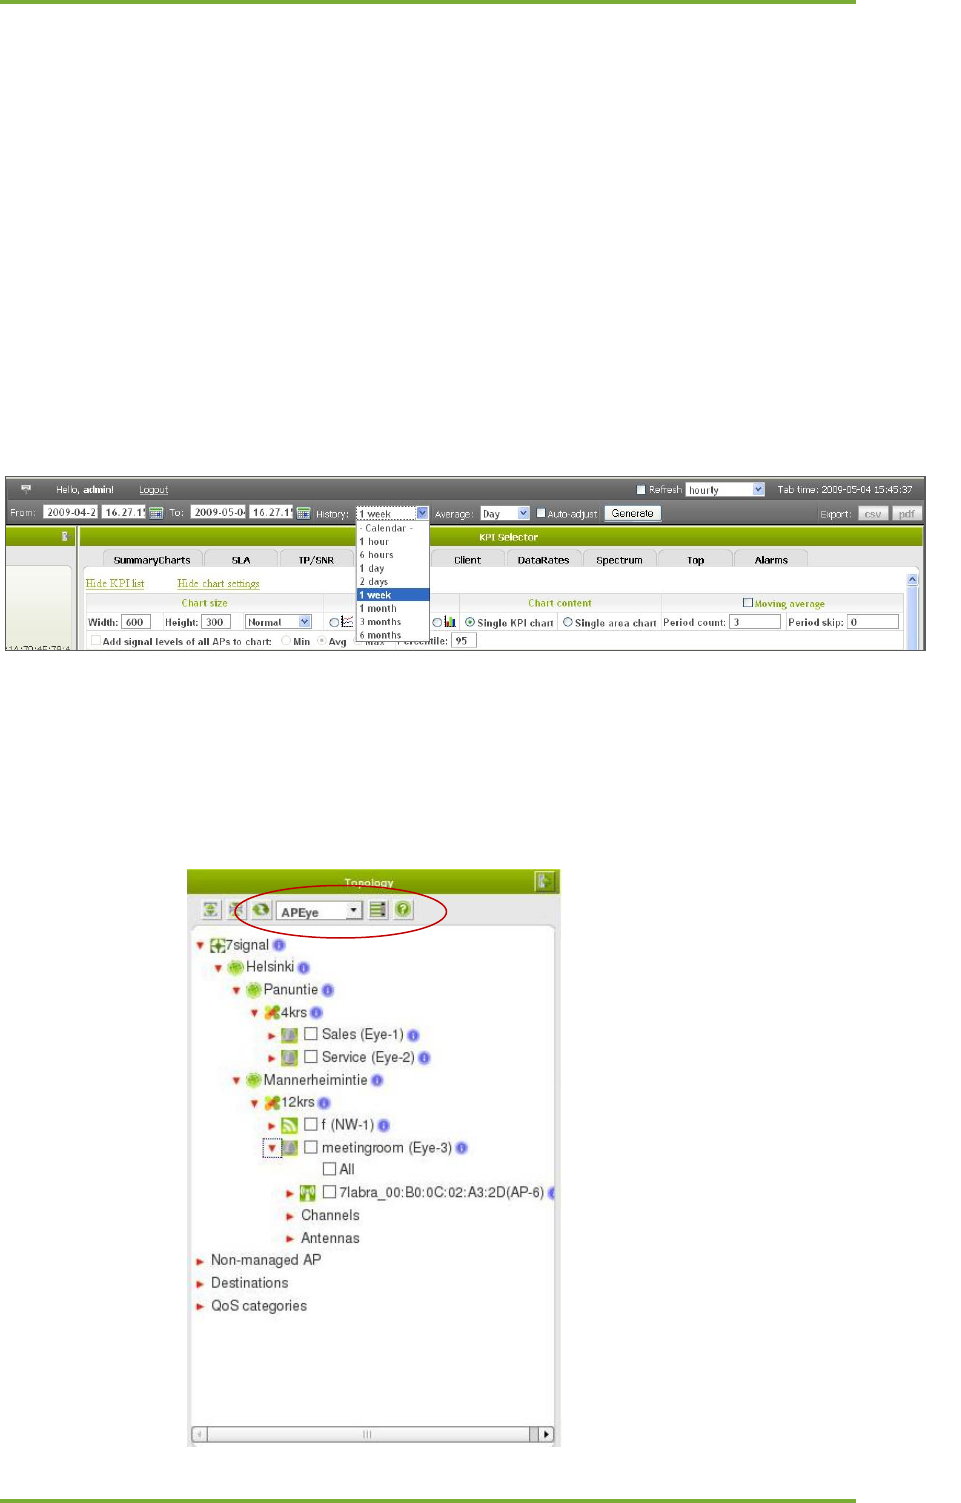
5. From the Topology view, choose the level of aggregation
a. aggregation is a set of qualifiers that limit the result set