
Application Guide


6 TP/SNR 12
7signal Ltd, Panuntie 6, FI-00620 HELSINKI, FINLAND, +358 40 777 7611, info@7signal.com, www.7signal.com
7signal Sapphire Loupe User Guide Release 3.0
6 TP/SNR
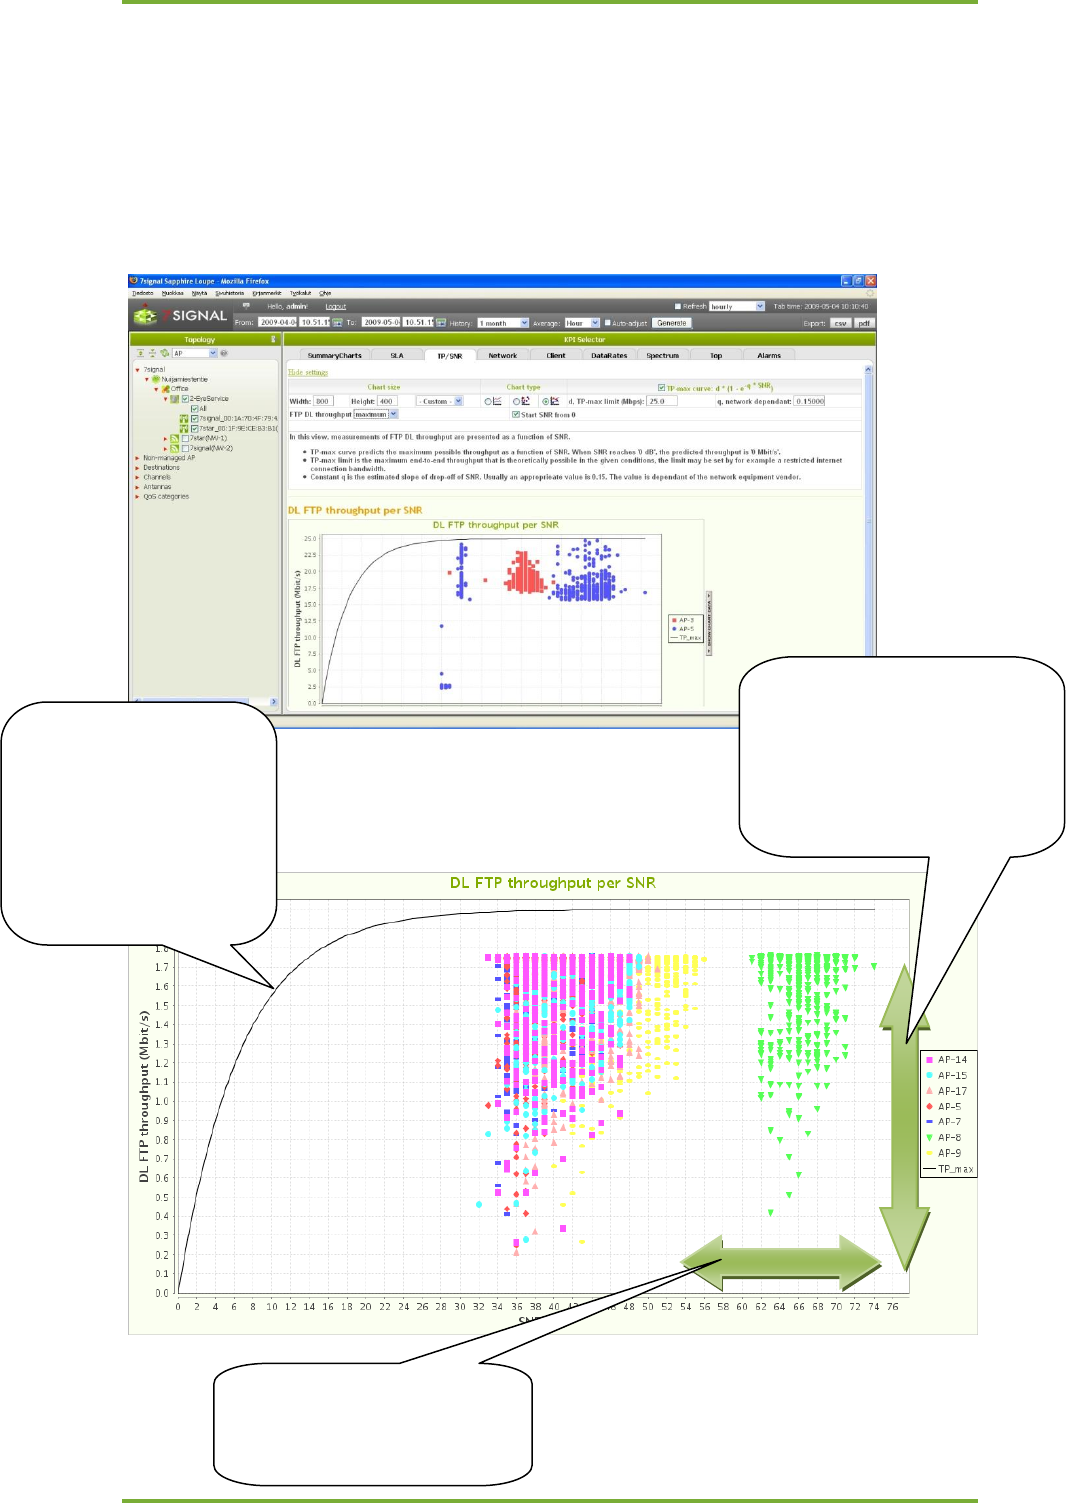
This view has a single chart, which displays the relationship between the measured throughput
speed and the signal to noise ratio of a given access point. Measurements usually take into
account only the theoretical maximum throughput speed. Since the measurements vary by
network and hardware, the view instructs the user to modify the parameters. Modify the
parameters directly in the view.
The picture below is an example on how to interpret the TP /SNR chart.
The maximum speed of
an end-to-end
connection is 2Mbps.
The theoretical TP/SNR
curve indicates the best
data throughput speed
for a given SNR value.
A large variation in
throughput rate when the
SNR value is good indicates
possible performance issues
in a wired network or a
severely loaded radio
Variation in the SNR indicates
variation in radio frequency
interference.