
Application Guide


4 Summary 9
7signal Ltd, Panuntie 6, FI-00620 HELSINKI, FINLAND, +358 40 777 7611, info@7signal.com, www.7signal.com
7signal Sapphire Loupe User Guide Release 3.0
4.1 Elementary KPIs
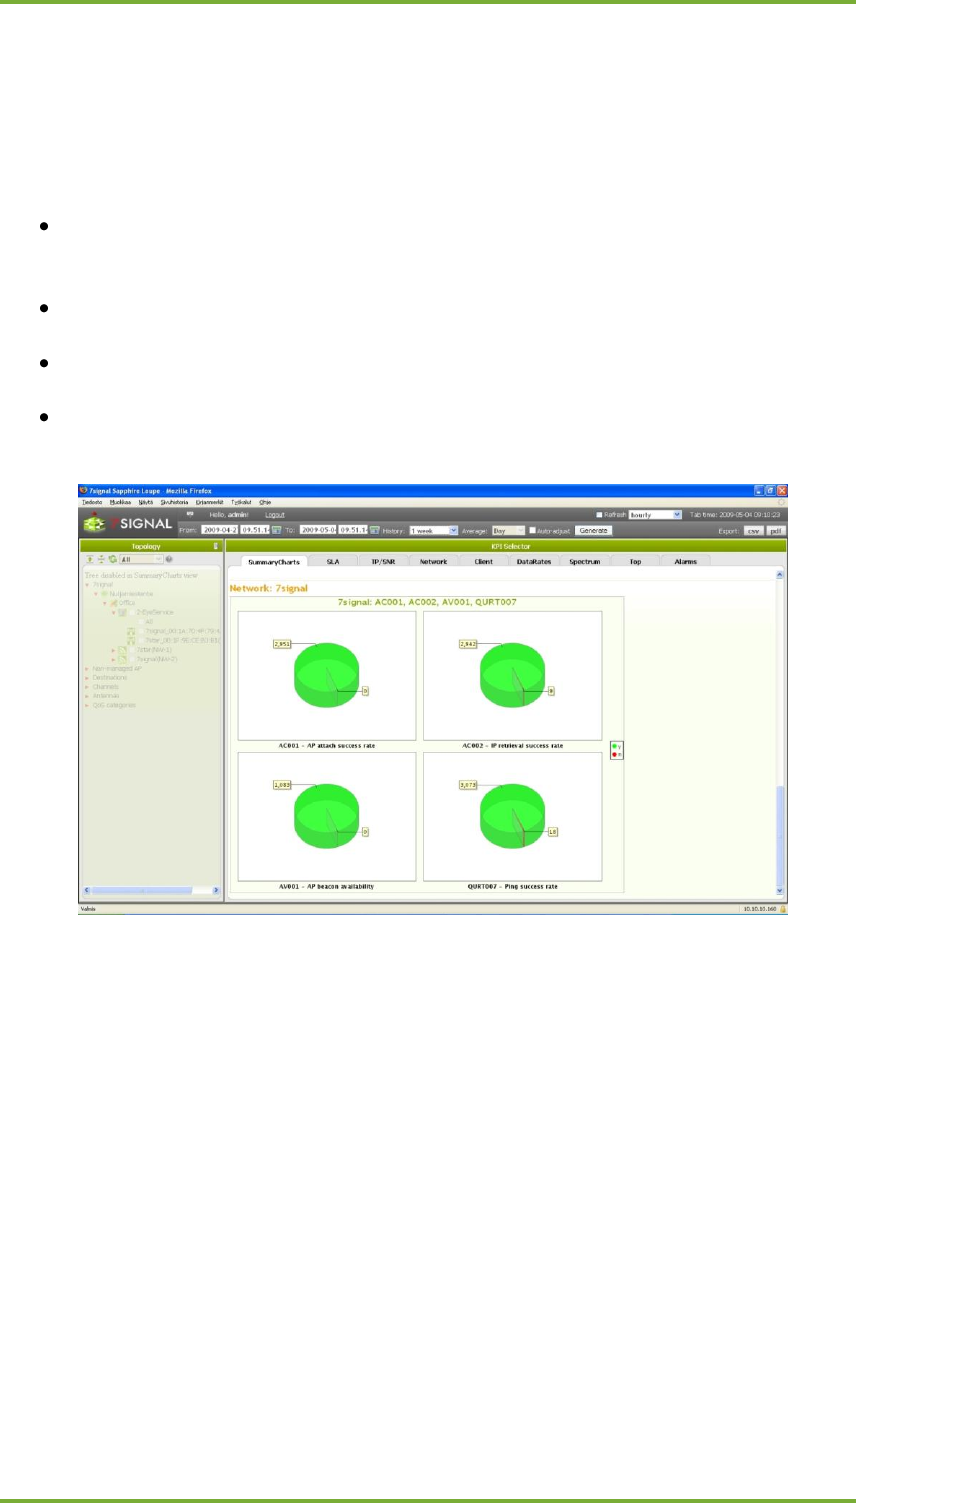
The Summary tab contains also pie charts on some elementary KPIs. By default, they are now
visible but the pie charts are available by selecting the wlan network name.
When expanded, Loupe displays a chart showing the general status of the monitored network
from the last 7 days. The view contains the following KPIs:
AP attach success rate
o the ratio of successful network attachments to the number of attachments
attempted
IP retrieval success rate
o the ratio of successful IP address retrievals to retrieval attempts
AP beacon availability
o heard beacon signal versus listening attempts
Ping success rate
o The ratio of successful reachability tests to the number of tests
The green area in the pie chart indicates successful measurements, and the red area indicates
failures. The number of measurements is displayed next to the chart.