
Application Guide


2 Using Loupe 6
7signal Ltd, Panuntie 6, FI-00620 HELSINKI, FINLAND, +358 40 777 7611, info@7signal.com, www.7signal.com
7signal Sapphire Loupe User Guide Release 3.0
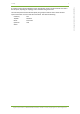
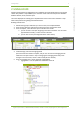
2. Chart type
a. Line, line with data points, scatter plot, bar chart
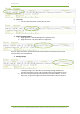
3. Display method of charts
a. Single KPI chart – Each KPI displayed as a separate chart
b. Single Area chart – All chosen KPIs in a single chart
Note! A “single area chart” should only contain measurements that have the same unit of
measurement, such as millisecond.
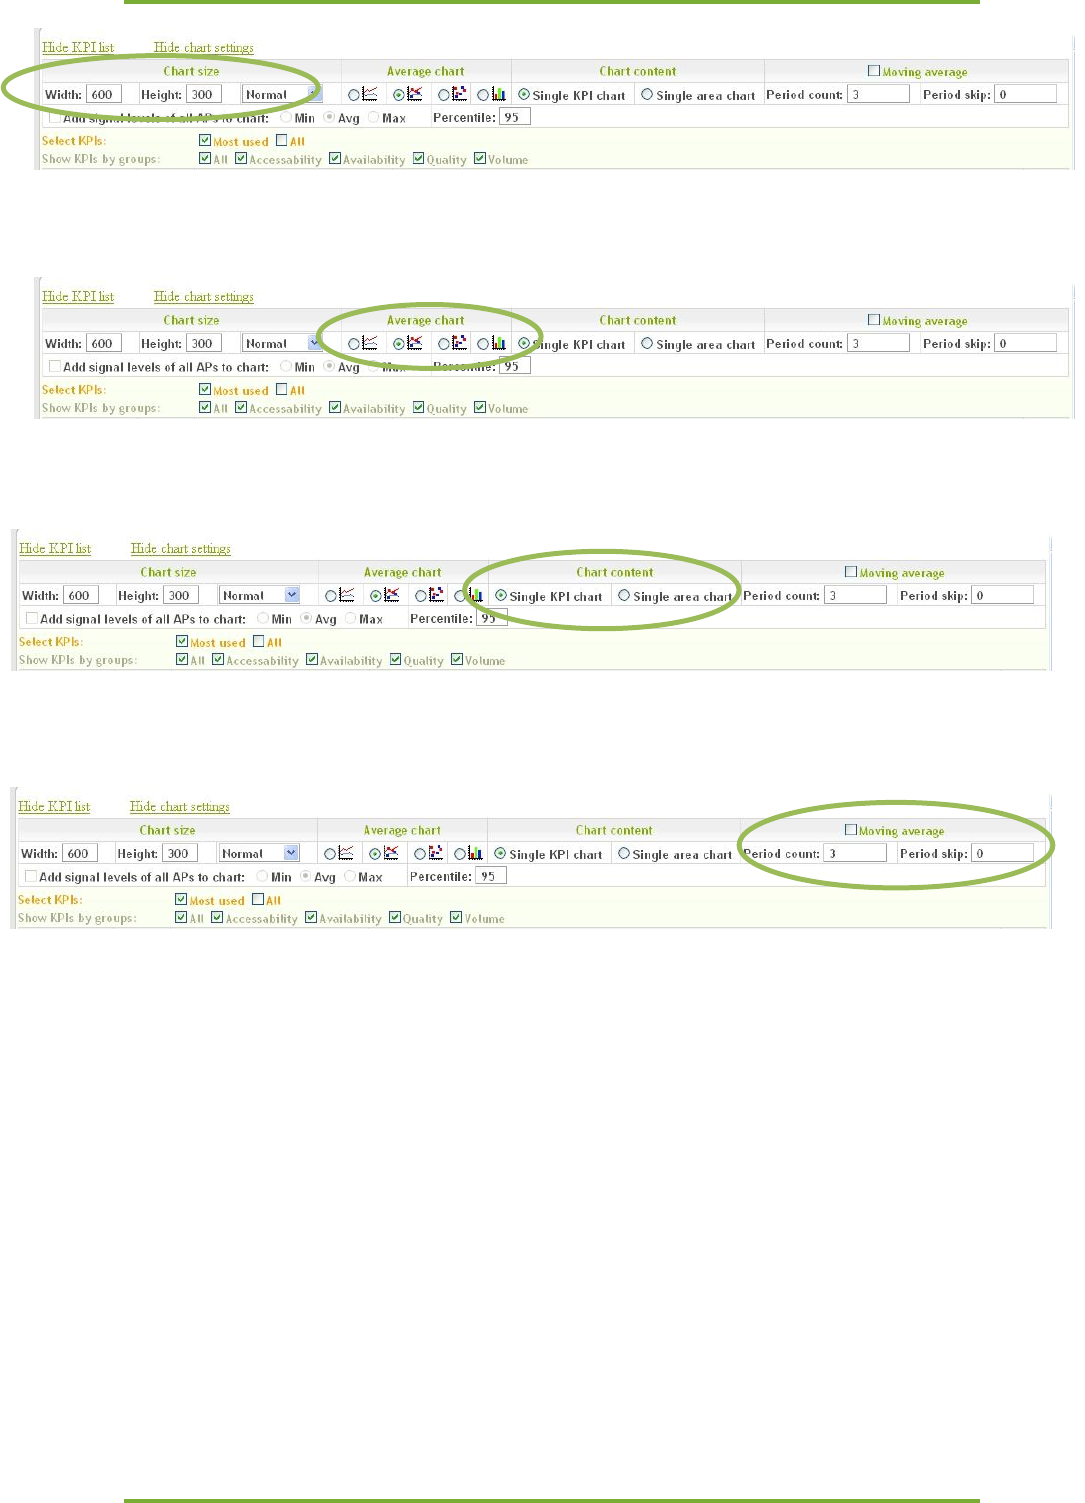
4. Moving average
a. Period count – the number of previous values to include into the calculation of
a moving average. F.ex. with value 3, the moving average at 8:00 is the
average of the values in 6:00, 7:00, and 8:00, when area-aggregation is hour.
b. Skip – the number of periods to skip from the start of the series. F.ex. for a
day’s serie, to ignore the night-time-values from 0:00 to 7:00, set skip to 8