
User guide


Examples 205
You can get an assessment of how much network capacity you have by
charting available ports using the Save to CSV facility in Reports, in
combination with an external CSV tool such as Microsoft Excel as follows:
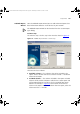
1 Launch the Reports dialog from Tools > Reports and select the Capacity
Report.
2 Click Generate Report.
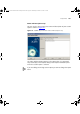
3 Select the History tab of the Reports dialog and select the generated
report in the table.
4 Click Save to CSV and choose a location for the CSV file.
5 Open the saved file in Microsoft Excel.
6 Select the IP Address column, by drag-clicking the cell entry with the
column title IP Address all the way down to the end of the IP Address
data.
7 Holding down CTRL, do the same with the Total Ports and Ports Available
columns.
8 Select Chart from the Insert menu.
9 Use the defaults of Chart Type: Column and Subtype: Clustered Column
and click Next.
10 Click Next on the Chart Source Data wizard step.
11 Click on the Titles tab on this wizard step, enter Network Capacity as the
chart title and click Next.
12 Choose to Place chart as new sheet and click Finish.
This gives you a graph showing at a glance how many ports you have free
across your range of 3Com devices and where the servers could be best
connected. You can also use Excel’s sorting feature to sort the table data
by Ports Available, for example.
3Com Network Administrator for HP OpenView.book Page 205 Wednesday, November 12, 2003 2:33 PM