
User Guide Hub/Switch SuperStack II Switch 1000


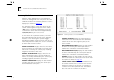


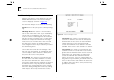
Table Of Contents
- About This Guide
- Getting Started
- Installation and Setup
- Setting Up for Management
- Managing The Switch 1000
- Setting Up Users
- Creating a New User
- Deleting a User
- Editing User Details
- Assigning Local Security
- Choosing a Switch Management Level
- Setting Up the Switch Unit
- Setting Up the Switch Ports
- Setting Up the Switch Database (SDB)
- Setting Up Resilient Links
- Setting Up Traps
- Setting Up the Console Port
- Resetting the Switch
- Initializing the Switch
- Upgrading Software
- Advanced Management
- Status Monitoring and Statistics
- Safety Information
- Screen Access Rights
- Trouble-shooting
- Pin-outs
- Switch 1000 Technical Specifications
- Technical Support
- Glossary
- Index
- 3Com Corporation Limited Warranty
- Electro-Magnetic Compatibility

Port Statistics 6-3
Port Statistics
With the Switch Management screen displayed,
choose the management level
Port
, then select the
STATISTICS button. The Port Statistics screen is dis-
played, as shown in Figure 6-2
. As well as showing
statistics for the port, the Port Statistics screen
allows you access to traffic and error counter
screens.
If the port is an ATM OC-3c Module port, the ATM
Port Statistics screen is displayed. For more informa-
tion, refer to the “SuperStack
®
II Switch ATM
OC-3c Module User Guide”.
The Port Statistics screen shows the following:
Port ID
The ID of the port you are currently manag-
ing.
Bandwidth Used
This counter provides a running
average of the bandwidth used by the port,
expressed as a percentage of the maximum band-
width available for the port. A sampling period of
one minute is used. The value gives an indication of
the general traffic level of the network. A high utili-
zation for single endstation segments is an indica-
tion that your network is operating efficiently.
However, if multiple endstations are connected to
this port and you see values of around 40% you
should reconsider the topology of your network
because each user will see degraded network per-
formance.
Figure 6-2
Port Statistics screen
Frames Forwarded
This counter provides a running
average of the proportion of frames received by the
port that are forwarded, expressed as a percentage
of all frames received by the port. A sampling
period of one minute is used.
Broadcast Frame Bandwidth
This counter provides
a running average of the broadcast frame band-
width used by the port, expressed as a percentage
of the maximum bandwidth available for the port. A
sampling period of five seconds is used.
Error Frames
This counter provides a running aver-
age of the number of errors per 10,000 frames
received by the port, expressed as a percentage.
Refer to the field description for Errors on page 6-5
.
TRAFFIC STATISTICS
Select this button to access
traffic counters for this port.
ERROR ANALYSIS
Select this button to access
error counters for this port.