
User guide

3B Scientific GmbH • Rudorffweg 8 • 21031 Hamburg • Germany • www.3bscientific.com
Subject to technical amendments
© Copyright 2007 3B Scientific GmbH
4. Technical data
Measurement range: 0 to ±50 m/s²
Sensor type: Capacitive semiconduc-
tor sensor
Sensitivity: Typically 400mV/g
Non-linearity: No more than ±1% of
the full measurement
range.
Resolution: 0.03 m/s²
Band width: typically 50 Hz
Drill hole for sensor
attachment: 3 mm diam. max.
5. Operation
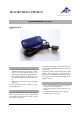
• Place the sensor box alongside the experiment
and attach the acceleration sensor (small black
box) to the mass to be investigated (target). Use
the supplied Velcro strip or a clamp for this
purpose.
• Read the value of the acceleration from the
display on the 3B NETlog
TM
unit.
6. Applications
Demonstration track and air track experiments:
Downward acceleration
Elastic and non-elastic impact
Oscillating spring-mass system
High-resolution measurement of objects’ inclina-
tion
Pendulum oscillations
Jumping experiments; “bungee jumping”
7. Sample experiment
Acceleration measurement in a damped oscillat-
ing spring-mass system
Required equipment:
1 3B NETlog
TM
interface U11300
1 3B NETlab
TM
software program U11310
1 5-g accelerometer U11363
1 Stand base U13270
1 Stand rod, 750 mm length U15003
1 Stand rod, 250 mm length U15001
2 Universal clamps U13255
1 Coil spring 3 N/m U15027
1 Weight 100 g, from U30016
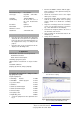
• Set up the equipment for the experiment as in
Fig. 1.
• Run the 3B NETlab
TM
software with the appro-
priate template for the experiment using the
5g accelerometer.
• Attach the acceleration sensor to the weight
with a piece of Velcro.
• Suspend the weight and acceleration sensor
from the eye at the bottom of the coil spring
and be careful not to hinder the oscillating
motion.
• Drape the connecting lead for the acceleration
sensor over the universal clamp, as shown in
Fig. 1. This adds further to the damping.
• Pull down the weight by hand to the level of
the stand base and release it.
• Start recording the measurement data in 3B
NETlab
TM
(Fig. 2).
• Analyse the recorded chart.
Fig. 1 Acceleration measurement for a damped oscilla-
tion of a mass on a spring
Fig. 2 Monitor display of the damped oscillation of a
mass on a spring in 3B NET
labTM (U11310)